Total phosphorus refers to the sum of various forms of phosphorus-containing substances and reflects the degree of eutrophication in a water body, making it a crucial indicator in water quality assessment. Traditional methods for detecting total phosphorus typically involve digestion, which is time-consuming, may cause secondary pollution, and is less stable due to environmental factors. Currently, water quality monitoring technology based on UV spectroscopy offers significant advantages, such as simplified detection processes and intuitive mathematical models, making it highly promising in the field of water quality monitoring.
1. Detection Principle
When the frequency of incident light matches the vibrational frequency of a substance's molecules, or when the incident light causes an electronic transition in the substance's molecules, optical absorption occurs. The higher the concentration of the solution, the more molecules are absorbed as the light passes through. Conversely, less light is absorbed as the concentration decreases.
Lambert-Beer's Law is the fundamental law of absorbance measurement, describing the relationship between the absorbance of a substance at a specific wavelength and the concentration of the absorbing substance, as well as the thickness of the liquid layer. When a parallel monochromatic light beam passes through a liquid layer of thickness bbb and a concentration ccc of a single, homogeneous, non-scattering colored solution, the absorbance of the solution is directly proportional to the solution's concentration and the thickness of the liquid layer:
A=kcb=lg(I0/I)
Where:
A is the absorbance
k is the molar absorption coefficient (typically in L/(mol*mm))
c is the concentration (typically in mol/L)
b is the path length (typically in mm)
I0 is the intensity of the incident light
I is the intensity of the transmitted light
2. Detection Process
1) Set Parameters: Configure the necessary settings on the host computer software.
2) Measure Dark Background: Turn off the light source and measure the dark background to account for dark noise before collecting spectral data.
3) Reference Measurement with Deionized Water: Turn on the light source and place deionized water at the measurement point to collect the reference spectrum I0.
4) Subtract Dark Background and Collect Signal: Subtract the dark background to mitigate noise, and use the host software to collect the spectral signal at the measurement point.
5) Measure Test Sample: Place the test liquid at the measurement point and collect the spectral signal I.
6) alculate Absorbance: Calculate the absorbance using the Lambert-Beer Law.
3. Experimental Example
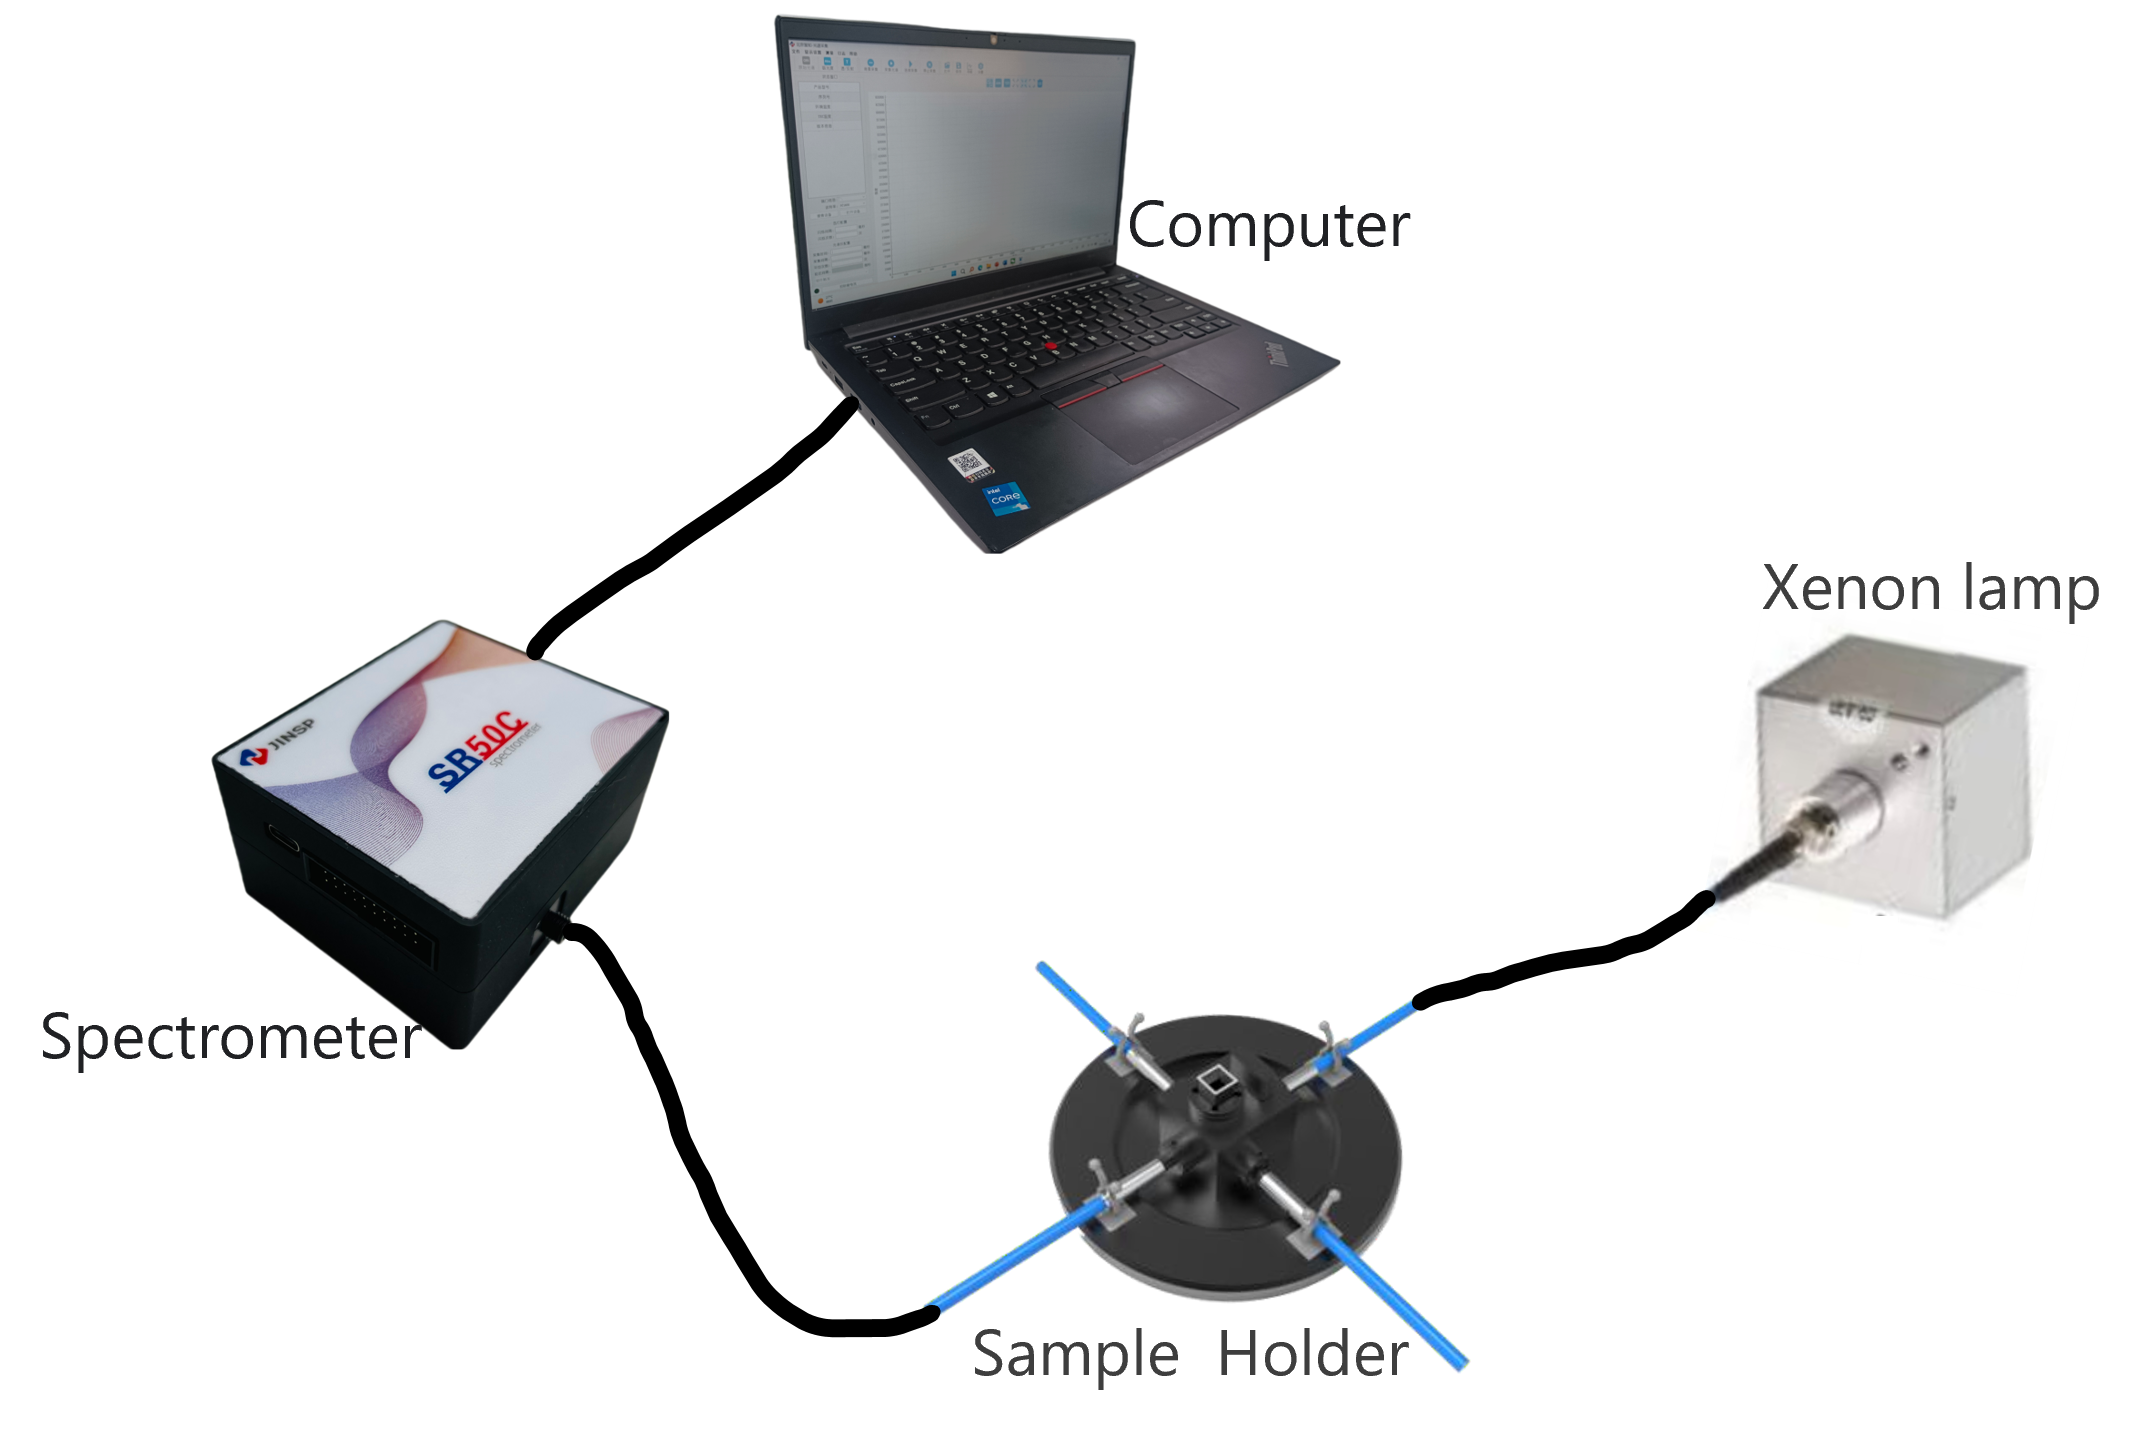
Jinsp has developed a complete set of spectral absorbance measurement systems, as shown in Figure 1. In this experiment, a total phosphorus solution was tested using the SR50C mini fiber optic spectrometer from Jinsp under room temperature conditions. The maximum absorption peak of total phosphorus occurs at 197 nm, where the absorbance is stable with varying concentrations. Therefore, 197 nm was selected as the measurement wavelength.

Figure 1: Pulse Xenon Lamp Water Quality Detection System
Phosphorus standard solutions with concentrations of 10, 20, 30, 40, and 50 mg/L were prepared by diluting the total phosphorus solution. Each concentration point was measured five times, and the average value was used to plot a linear relationship between the absorbance and the concentration of the phosphorus standard solution.
4. Product Recommendation
The Jinsp SR50C fiber optic spectrometer can be paired with a sample cell, pulse xenon lamp, and other accessories to detect total nitrogen and total phosphorus content in water quality. The SR50C spectrometer is also equipped with a high-resolution grating, detector, and data processing system, providing high-precision absorbance spectral data.
For more details, visit Best SR50C miniature spectrometer manufacturers and suppliers | JINSP (jinsptech.com)
5. Product Advantages
Small size, lightweight, and high resolution
High sensitivity, suitable for trace element analysis
High accuracy and consistency in measurements
Post time: Aug-23-2024

