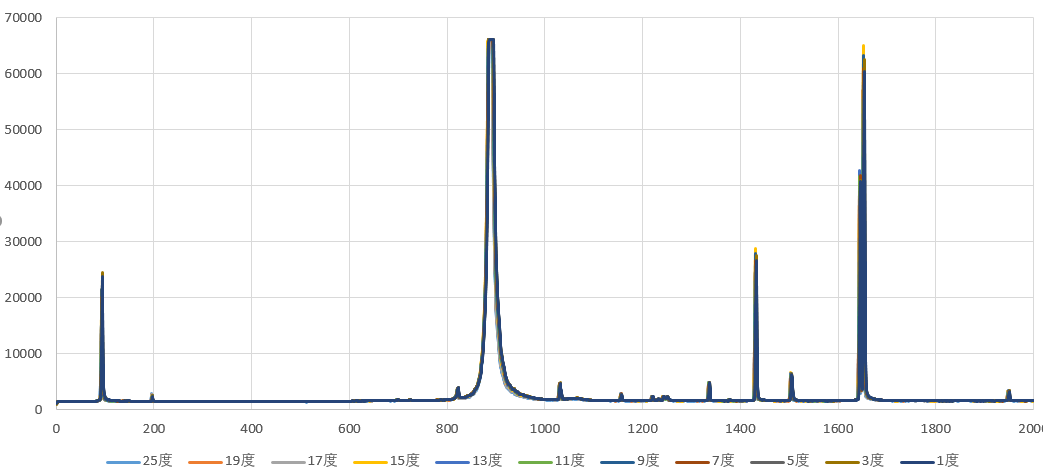
Electronic components usually have a certain temperature coefficient, and their output signals will drift with temperature changes, which is called "temperature drift". In order to reduce temperature drift, some compensation measures are used to offset or reduce the temperature drift of the output to a certain extent. This is temperature compensation. The following method is proposed for the temperature drift of the spectrometer, and the feasibility of the method is tested through experiments.
1. Model Description
Choose a mercury-argon lamp light source with multiple characteristic spectral lines to cover the wavelength range[λL,λH].Then place the spectrometer in a temperature adjustable high and low temperature environment box with a temperature adjustment range of[TL,TH],and a variation of ΔT=(TH-TL)/(M-1),where M is the number of standard points of the characteristic peak of the light source. The smaller ΔT is, the higher the accuracy is and the stronger the temperature adaptability is.
According to the known standard wavelength of characteristic spectral lines at different temperatures and the position of the corresponding pixel on the CCD, a polynomial relationship based on temperature compensation is established:

In the formula, c0~c9 are polynomial coefficients. According to multiple sets of wavelengths and corresponding pixel data at different temperatures, the least squares method is used to solve c0~c9 in the formula, and finally the relationship between pixel position, wavelength and temperature is determined.
2. Specific Calibration Process
1) At the beginning of calibration, place the spectrometer in a temperature box and set the temperature. After calibration at each temperature point, the temperature is increased by ΔT.
2) When performing wavelength calibration, connect a standard light source, select the corresponding temperature calibration point T, and record the pixel position corresponding to the peak wavelength of the characteristic spectral line at temperature T.
3) Determine whether all temperature points have been tested. If so, end the temperature calibration cycle and enter the surface fitting process; if not, increase the temperature ΔT and continue.
4) Performing surface fitting with a third-order polynomial to fit the wavelength calibration curve λ(x, T) and obtain the polynomial coefficients c0~c9, thereby completing the wavelength calibration based on temperature compensation.
3. Experimental Operation Process
1) The wavelength range of the SR75C fiber spectrometer of JINSP is 180-340nm, and the total number of pixels of the linear array CCD detector is 2048. When calibrating the wavelength, the characteristic spectrum of the mercury-argon lamp is evenly selected, and 2-4 characteristic wavelength peaks of the mercury-argon lamp are selected according to the model description. The temperature range is selected to be 0℃~40℃. According to the test results, the detector pixel position corresponding to the standard wavelength at different temperatures is recorded.

2) Use the cubic polynomial fitting method based on the least squares method to solve the polynomial coefficients c0~c9. After fitting, check the size of the root mean square RMSE to determine the error between the fitting curve and the true curve.
3) Test the spectrometer after wavelength calibration. The peak wavelength of the spectrometer after calibration was measured at low temperature 0℃ and high temperature 40℃, and the difference between it and the standard wavelength was calculated and analyzed. This method can improve the accuracy of wavelength calibration.
Post time: Jul-18-2024

